🌡️ Thermographic Root Cause Analysis
A visual summary of diagnostic work involving pyrometer sensor placement, thermal reflection interference, and emissivity control using simulated and real-world tools. All visuals are fictionalized for training and NDA compliance.
🔬 Pyrometer and Thermocouple Setup (Concept Drawing)

An initial engineering sketch outlining the pyrometer and thermocouple layout used in thermal measurements.

🖊️ Conceptual Drawing – Pyrometer Thermocouple Setup
This conceptual drawing illustrates the initial pyrometer thermocouple layout designed for the shop floor.
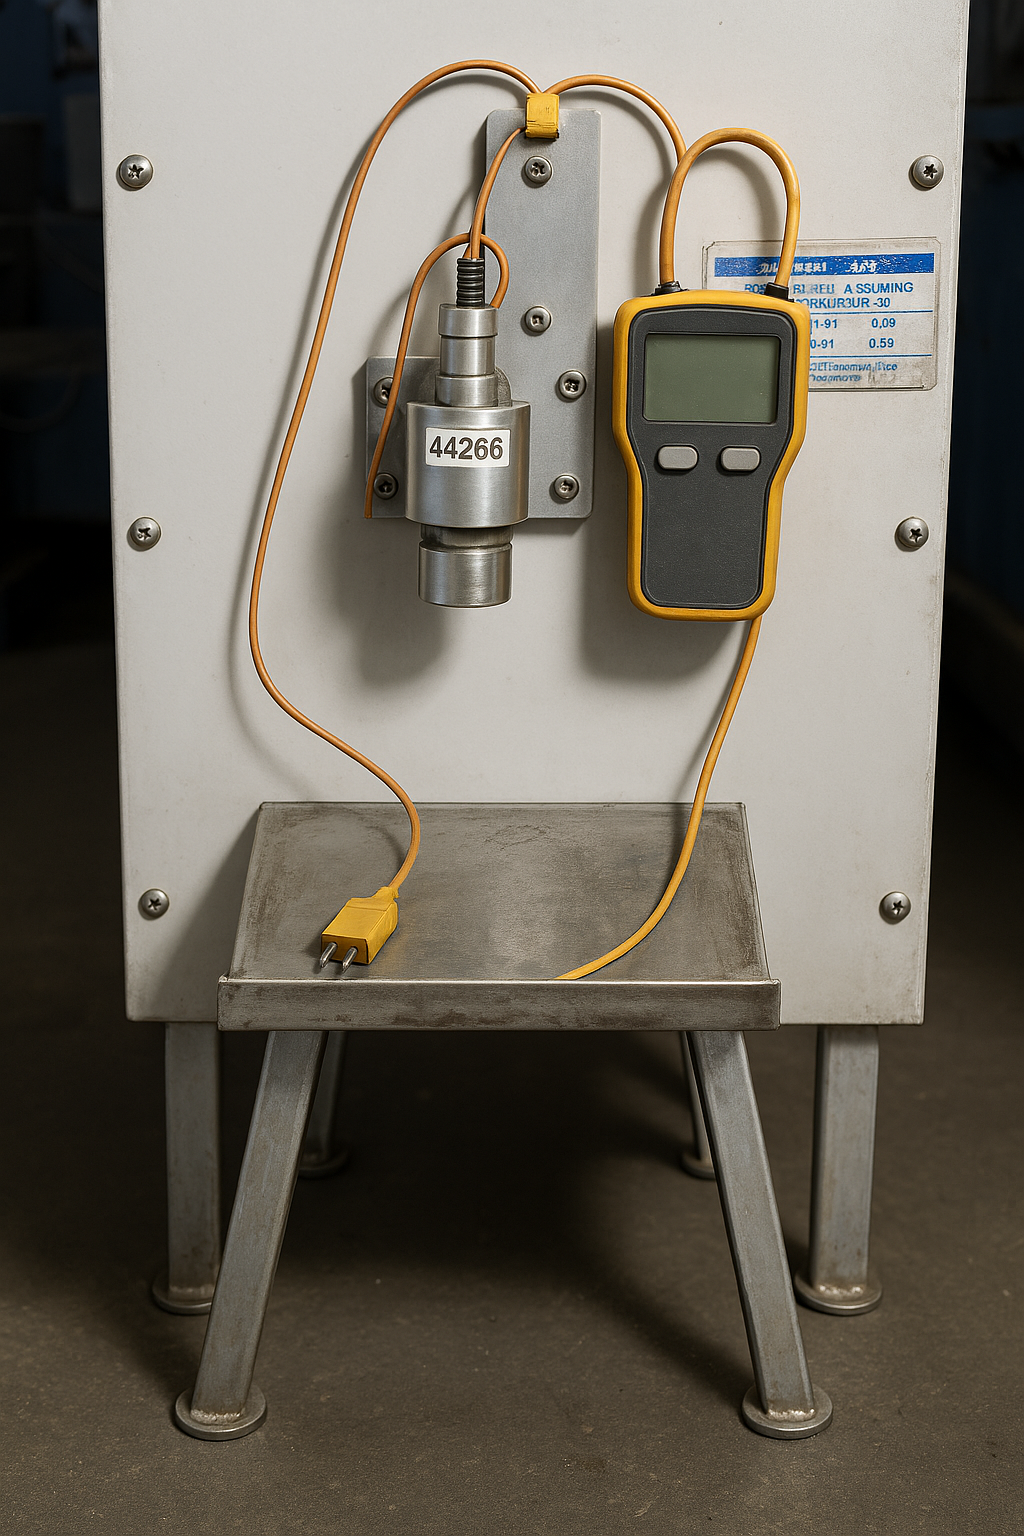
🏭 Simulated Shop Floor Visualization

AI-generated visual of the early temperature monitoring layout — designed to explain setup without using real-site photography.
Note: This is a conceptual illustration used to communicate engineering strategy without exposing proprietary elements.
📏 Surface Temperature Verification

Performed surface temperature scans using a Raytek IR thermometer to verify readings and diagnose emissivity mismatch and reflective interference during aluminum thermal profiling.
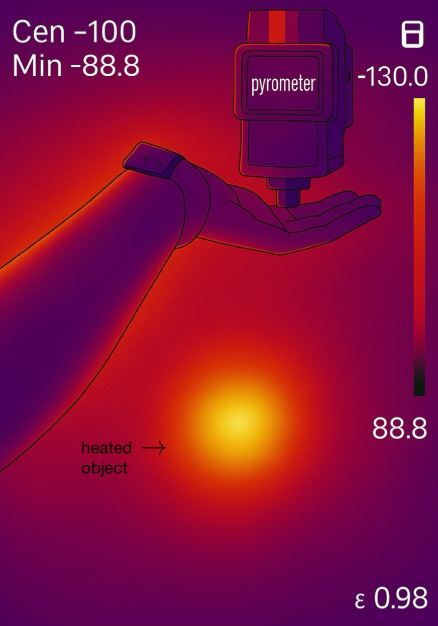
🔧 Troubleshooting Pyrometer Errors in Forging Process

Used hand emissivity (~0.98) to validate thermal reflections and confirm sensor misalignment under high ambient heat conditions.
Note: Representative visual used to communicate diagnostic insights without disclosing proprietary shop floor layouts.
🛠️ Concept vs Simulation Overview

Tap to temporarily zoom
All visuals shown here are anonymized or simulated. Intended for technical validation training and engineering communication.
Connect with Me█
LinkedIn: linkedin.com/in/audrey-enriquez-382b9b201
Email: audreyenriquez98@gmail.com
© 2025 Audrey Enriquez.
All content is shared for educational and documentation purposes only.
No proprietary or confidential information is disclosed. All rights reserved.